Video content on Facebook is enhances the user experience and attracts higher engagement from users.
Facebook video ads get on average a 6% engagement rate vs. 0.90% for the average post.
Video ads cut through the clutter of the Facebook News Feed and gives you the chance to share what makes your dealership special, your monthly incentives and inventory.
Facebook Video Measurement
Video continues to become more important on Facebook, in fact 15% of all Facebook content is video.
So, it is vital for your dealership to measure and track the performance of your social media ad types, like video, and understand which marketing strategies are growing your business on social platforms.
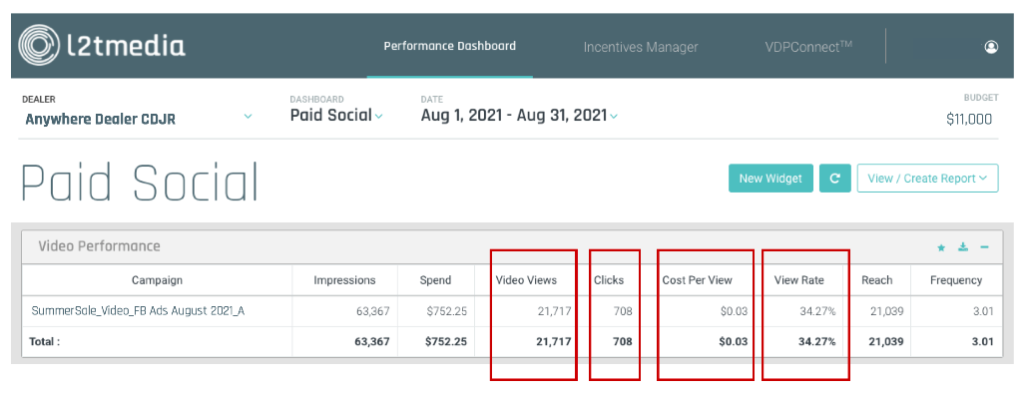
The enhanced metrics displayed in our Performance Dashboard measures how Facebook videos ads are performing to give you greater transparency into your campaigns so you can evaluate success just like you would for YouTube videos.
How It Looks in the Dashboard

Video Metrics Now Available:
- Video Views
- Clicks
- Cost Per View
- View Rate
Customize Your Own Data and Reports
L2T’s custom dashboard was created with dealers in mind and is totally customizable. This supplies you with a single destination to summarize and highlight transparent key performance indicators by all ten advertising channels, including Paid Social, that can be broken down to the campaign level.
To learn more about our Performance Dashboard or Paid Social video opportunities contact us today!
Already have a dashboard login? Login to see your performance.

